Shift Left Security with Microsoft Security DevOps (MSDO)
With the new capabilities released add Ignite, you are now even more capable of shifting security checks further to the left. In this article, I explain how to get started by adding DevOps and GitHub to Defender for Cloud, which does the first part. In this article, we will look more into integrating security right into DevOps pipelines.
To integrate the security checks in your pipeline and, Ideally, also in your pull request annotations, some prerequisites are needed that are by default not in Azure DevOps:
- The Microsoft Security DevOps extensions: This is an Azure DevOps extension required to do a security scan within Azure DevOps.
- The SARIF SAST Scans Tab extensions: This Azure DevOps extension adds a Scan tab to the Azure DevOps pipeline that shows scan results.
These extensions can be installed from the Visual Studio Marketplace:
- Microsoft Security DevOps - Visual Studio Marketplace
- SARIF SAST Scans Tab - Visual Studio Marketplace
The Microsoft Security DevOps Extension
The Microsoft Security DevOps extension is a wrapper around the Microsoft.Security.DevOps.Cli. The CLI is the Microsoft Security DevOps (MSDO), a command-line application that integrates static analysis tools into the development cycle.
The tool installs and configures static analysis tools and saves the results in a format called SARIF. In the table below, the tools it uses are listed.
Getting Started
First, create a new Pipeline in Azure DevOps and make sure that the pipeline supports ".Net 3.1" and ".Net 6.0". These are required to run the Security DevOps Extension, which can be done by adding the tasks below to the pipeline.
- task: UseDotNet@2
  displayName: 'Use dotnet 3.1'
  inputs:
    version: 3.1.x
- task: UseDotNet@2
  displayName: 'Use dotnet 6.0'
  inputs:
    version: 6.0.x
These actions must be run before the extension itself to ensure that all components on the build agent are configured, and the Security for DevOps scan can run successfully.
- task: MicrosoftSecurityDevOps@1
  displayName: 'Run Microsoft Security DevOps'
The above task executes the scanner and publishes the result by default in the "CodeAnalysisLogs" artifact. To display the scan results, this artifact needs to be published. When published, the scan results will appear in the pipeline's "Scans" tab. To publish the results, add the below Publish task.
- task: PublishBuildArtifacts@1
  condition: always()
  inputs:
    PathtoPublish: '$(Build.ArtifactStagingDirectory)'
    ArtifactName: 'CodeAnalysisLogs'
    publishLocation: 'Container'
Putting all of this together ensures that the results are published and viewable in the "Scans" tab when you run the pipeline. The example below shows the result of a scan on one of my repos that contains some bicep files.
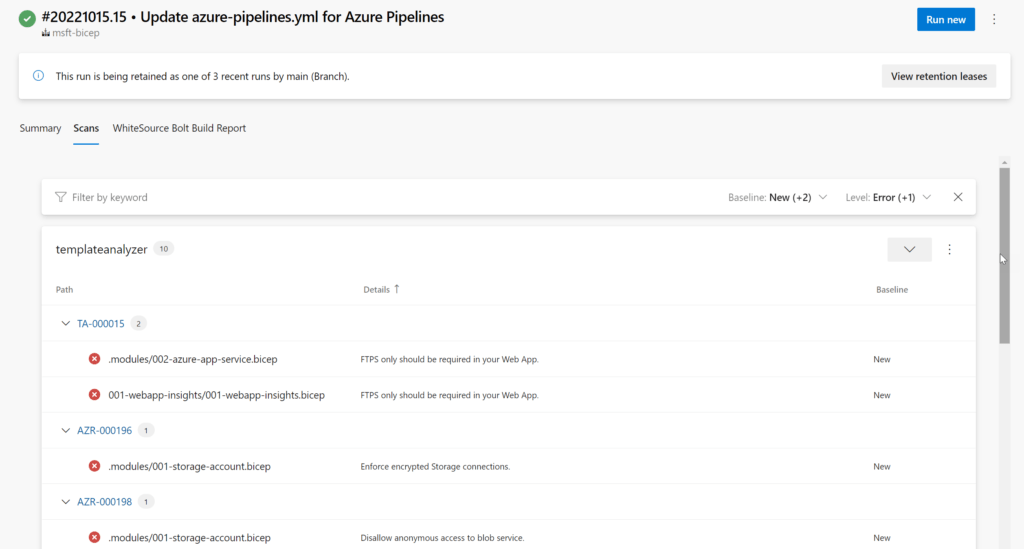
The complete pipeline YAML file looks like below. Some parts are left out for simplicity.
trigger:
- main

pool:
  vmImage: windows-latest

variables:
  - name: system.debug
    value: true

steps:
- task: UseDotNet@2
  displayName: 'Use dotnet 3.1'
  inputs:
    version: 3.1.x
- task: UseDotNet@2
  displayName: 'Use dotnet 6.0'
  inputs:
    version: 6.0.x
- task: MicrosoftSecurityDevOps@1
  displayName: 'Run Microsoft Security DevOps'
- task: PublishBuildArtifacts@1
  condition: always()
  inputs:
    PathtoPublish: '$(Build.ArtifactStagingDirectory)'
    ArtifactName: 'CodeAnalysisLogs'
    publishLocation: 'Container'
Information
If you want to learn more about Microsoft Defender for Cloud or especially Defender for DevOps, check out the following resources:
Comments