Trace listeners (Logging) with Application Insights
For every application that is build a logging framework needs to be present. Tracing and Application are framework that can be used in almost every situation.
Application Insights is an extensible Application Performance Management (APM) service for web developers on multiple platforms. It can be used to monitor your live web application. It can automatically detect performance anomalies and includes powerful analytics tools to help you diagnose issues and to understand what users actually do with your app.
Trace listeners (Tracing) on the other end are objects that get tracing information from the trace class and output the data to a medium that is configured. For instance you can write trace information to a UI, file or a windows event log.
Trace information can be send to Application Insights by making use of the Application Insights trace listener.
Custom Tracing class
Write a custom tracing class for your application. This class can be a static class because we do not want to initiate the class and it needs to be constructed only once. In the class methods need to be created for every event severity.
public static class AppTrace {
    private static TraceSource traceSource { get; set; }

    static AppTrace() {
        traceSource = new TraceSource("TraceLogging");
    }

    public static void Verbose(string message, int id = 16, [CallerMemberName]string memberName = "", [CallerFilePath] string filePath = "", [CallerLineNumber]int lineNumber = 0) {
        traceSource.TraceEvent(TraceEventType.Verbose, id, Format(message, memberName, filePath, lineNumber));
    }

    public static void Error(string message, int id = 2, [CallerMemberName]string memberName = "", [CallerFilePath] string filePath = "", [CallerLineNumber]int lineNumber = 0) {
        traceSource.TraceEvent(TraceEventType.Error, id, Format(message, memberName, filePath, lineNumber));
    }

    public static void Information(string message, int id = 8, [CallerMemberName]string memberName = "", [CallerFilePath] string filePath = "", [CallerLineNumber]int lineNumber = 0)
        traceSource.TraceEvent(TraceEventType.Information, id, Format(message, memberName, filePath, lineNumber));
    }

    public static void Critical(string message, int id = 1, [CallerMemberName]string memberName = "", [CallerFilePath] string filePath = "", [CallerLineNumber]int lineNumber = 0) {
        traceSource.TraceEvent(TraceEventType.Critical, id, Format(message, memberName, filePath, lineNumber));
    }

    public static void Warning(string message, int id = 4, [CallerMemberName]string memberName = "", [CallerFilePath] string filePath = "", [CallerLineNumber]int lineNumber = 0) {
        traceSource.TraceEvent(TraceEventType.Warning, id, Format(message, memberName, filePath, lineNumber));
    }

    public static void Start(string service, int id = 256, [CallerMemberName]string memberName = "", [CallerFilePath] string filePath = "", [CallerLineNumber]int lineNumber = 0) {
        traceSource.TraceEvent(TraceEventType.Start, id, Format("Starting - " + service, memberName, filePath, lineNumber));
    }

    public static void Stop(string service, int id = 512, [CallerMemberName]string memberName = "", [CallerFilePath] string filePath = "", [CallerLineNumber]int lineNumber = 0) {
        traceSource.TraceEvent(TraceEventType.Stop, id, Format("Stoping - " + service, memberName, filePath, lineNumber));
    }

    private static string Format(string message, string memberName, string filePath, int lineNumber) {
        return $"Message: {message}, MemberName: {memberName}, FilePath: {filePath}, LineNumber: {lineNumber}";
    }
}
In the constructor the source name is configured this makes it possible to bind the trace listeners within the application configuration.
Application Insight trace listener
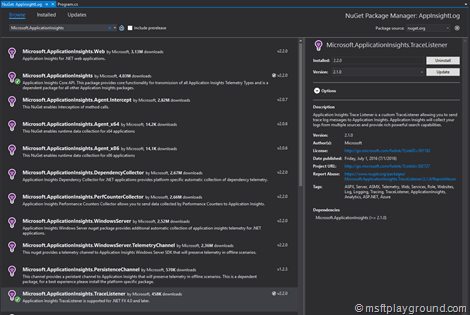
For sending trace information to Application Insights a reference needs need to be added to the project by adding "Microsoft.ApplicationInsights.TraceListener" NuGet package.
From the “Package Manager Console”
Install-Package Microsoft.ApplicationInsights.TraceListener
From the “Package Manager UI”
Configure the trace listener
To bind trace listeners to the trace source they need to be configured within the web.config or app.config. This can be done by adding the below configuration section within the configuration tag.
<system.diagnostics>
  <sources>
    <source name="TraceLogging" switchName="Verbose">
      <listeners>
        <add name="appinsights" type="Microsoft.ApplicationInsights.TraceListener.ApplicationInsightsTraceListener, Microsoft.ApplicationInsights.TraceListener"/>
        <add name="console" type="System.Diagnostics.ConsoleTraceListener" />
      </listeners>
    </source>
  </sources>
</system.diagnostics>
Within our class the trace listeners are referenced by using the source name “TraceLogging”.
Within the configuration of the “Source” the listeners are configured. In the snip-it above it has a listener for Application Insights and for the Console Window. This means that depending on the “TraceLevel” of the message the message will be send to Application Insights and to the Console.
Which messages are send to the listeners depend on the switch. In the "source" tag it is configured by the "swithName" property. The switch is something you would like change when you find a problem within your application.
Azure
At the moment it is not possible to change tracing configuration within the Azure Portal that will reflect the above settings. To be able to make this configurable you can add a specific app setting to be able to set the switch in code.
Besides the switch you should also make the Id ("InstrumentationKey") of the Application Insights service configurable.
Additions to keep it configurable
Web.config
Add an application setting for the instrumentation key and trace switch.
<appSettings>
  <add key="InstrumentationKey" value="[key]"/>
  <add key="TraceSwitch" value="All"/>
</appSettings>
Trace Class
To make use of these settings we also need to adjust the constructor of our class. Make the following adjustments to the constructor.
static AppTrace() {
    traceSource = new TraceSource("TraceLogging");
    traceSource.Switch.Level = (SourceLevels)Enum.Parse(typeof(SourceLevels), ConfigurationManager.AppSettings["TraceSwitch"], true);
    TelemetryConfiguration.Active.InstrumentationKey = ConfigurationManager.AppSettings["InstrumentationKey"];
}
Write information to the Trace Log
With everything in place it is easy to write monitoring information to any source of your choosing, and depending on the level specified in the settings information will be send to the log.
class Program {
    static void Main(string[] args) {
        AppTrace.Verbose("Test Verbose");
        AppTrace.Error("Test Error");
        AppTrace.Warning("Test Warning");
        AppTrace.Information("Test Information");
        AppTrace.Critical("Test Critical");

        Console.ReadKey();
    }
}
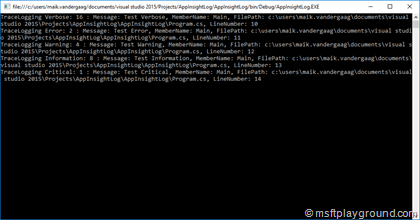
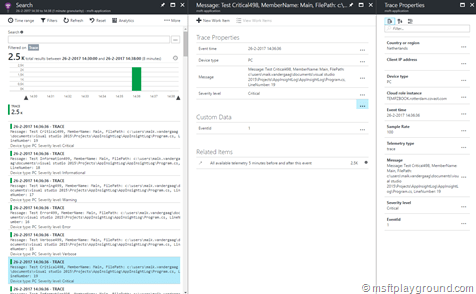
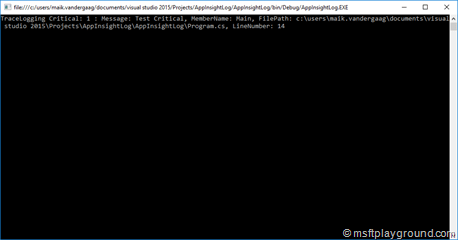
Starting this console application will show messages within in the console and Application Insights:
Console Output
Application Insights Output
As we change the “TraceSwith” setting to for example “Critical” you will see within the console window that less information is send by the trace source.
